library(patchwork)
library(ggplot2)

library(ggplot2)
p1 <- ggplot(mtcars) +
  geom_point(aes(mpg, disp)) +
  ggtitle('Plot 1')

p2 <- ggplot(mtcars) +
  geom_boxplot(aes(gear, disp, group = gear)) +
  ggtitle('Plot 2')

p1 + p2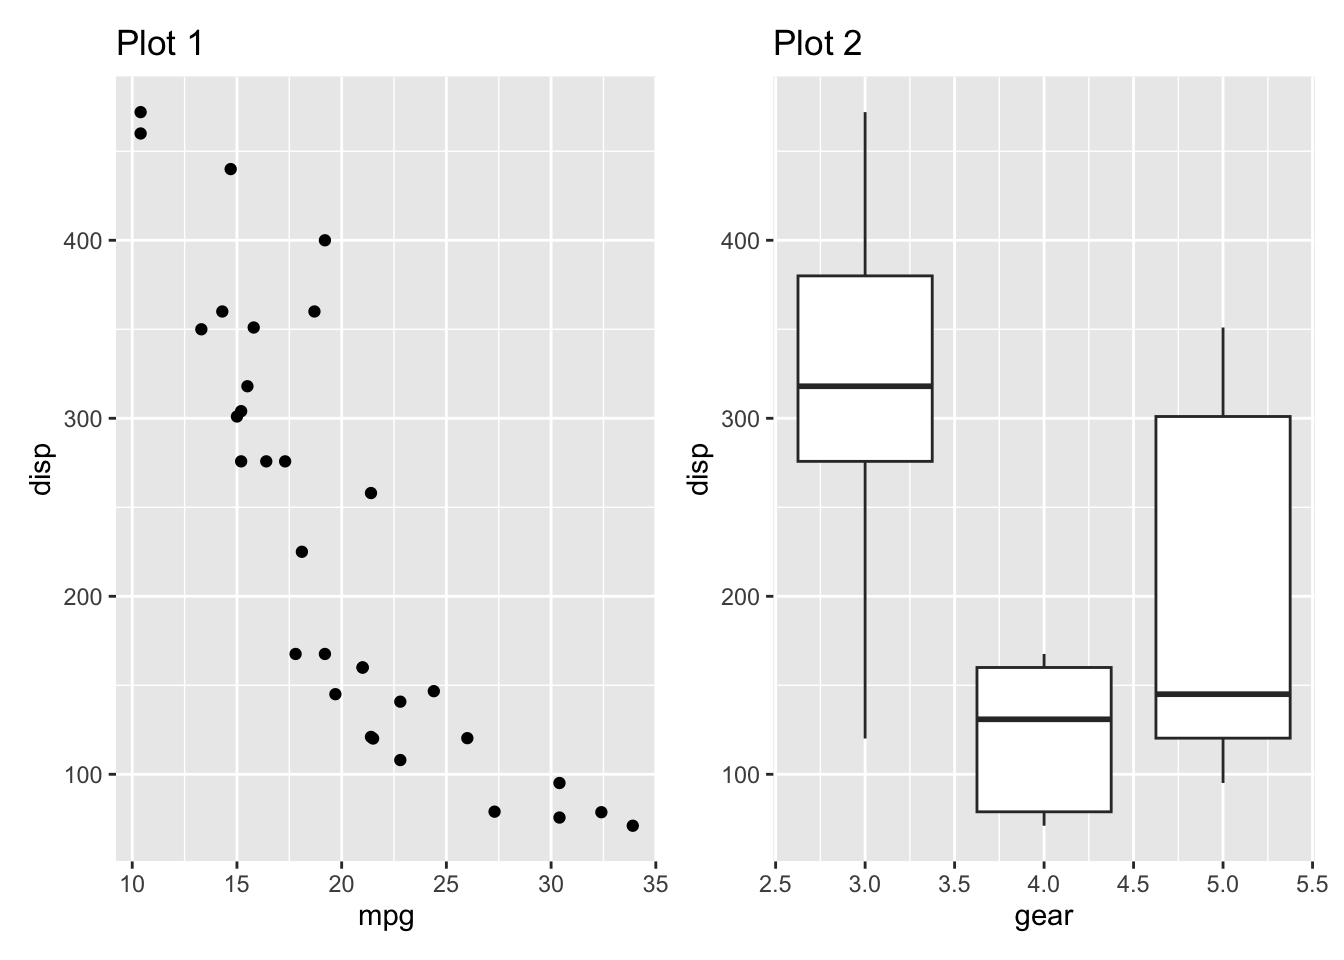
What is that? Another blog post not even a month after the last? This feels like 2017. Maybe I’m a bit extra attentive because I’ve had fun porting over my blog to quarto and also finally building a proper site for my generative art rather than lumping it into my R/OSS blog. Or maybe I just finally have interesting to share for the first time in a while…
That interesting thing today is a new release of patchwork — my package for easily combining multiple plots into complex and well-aligned compositions. It is not the grandest of releases — after all the package does what it does well — but it does provide two new features that I’ve been looking forward to:
One of the features in patchwork I’m particularly fond of is it’s ability to collect and de-duplicate legends. It is one of those touches that makes the final composition feel like a whole. Missing from this has been a similar function for axes. This has been even more glaring because we are used to de-duplicated axes from faceted plots and not having that in patchwork felt wrong. I always intended on adding this but never got around to it but thankfully Teun van den Brand took a stab at it and filled the gap.
This new functionality is two-fold as it is split up in axes and axis titles (though the setting for axis titles defaults to that for axes so you can usually get by only setting it for axes).
Consider these two plots:
library(patchwork)
library(ggplot2)
library(ggplot2)
p1 <- ggplot(mtcars) +
geom_point(aes(mpg, disp)) +
ggtitle('Plot 1')
p2 <- ggplot(mtcars) +
geom_boxplot(aes(gear, disp, group = gear)) +
ggtitle('Plot 2')
p1 + p2
As we can see they share the exact same y-axis and you might want to avoid the visual clutter of keeping the axis of the rightmost plot. Of course you could remove it through theming, setting the relevant theme elements to element_blank(). But that is such a hassle! Using the axis collecting is much easier:
p1 + p2 + plot_layout(axes = "collect")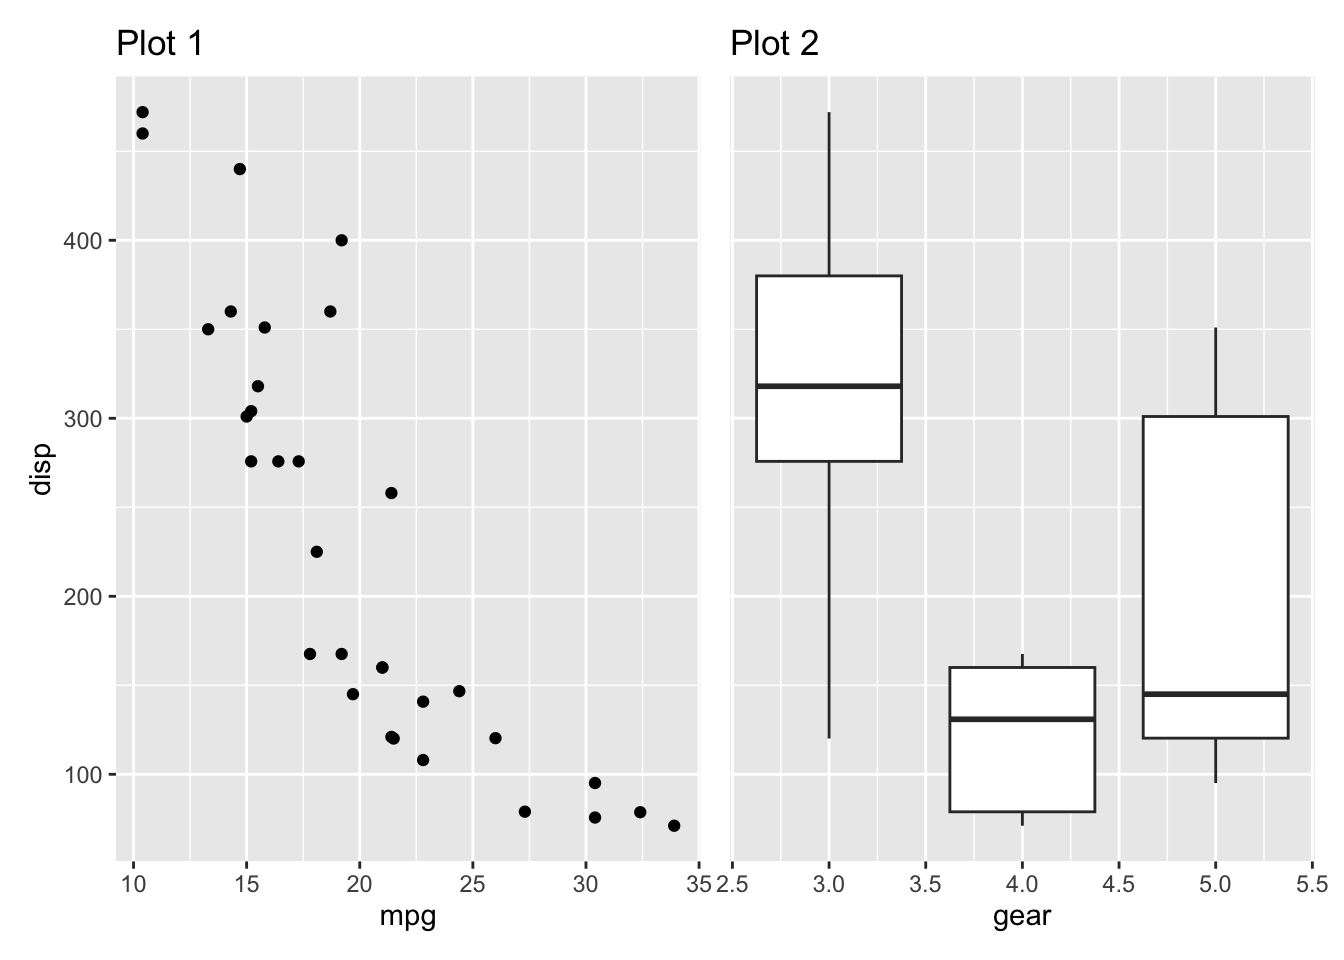
If you like the clarity of the axis but prefer to not keep the title, you use the axis_titles argument instead
p1 + p2 + plot_layout(axis_titles = "collect")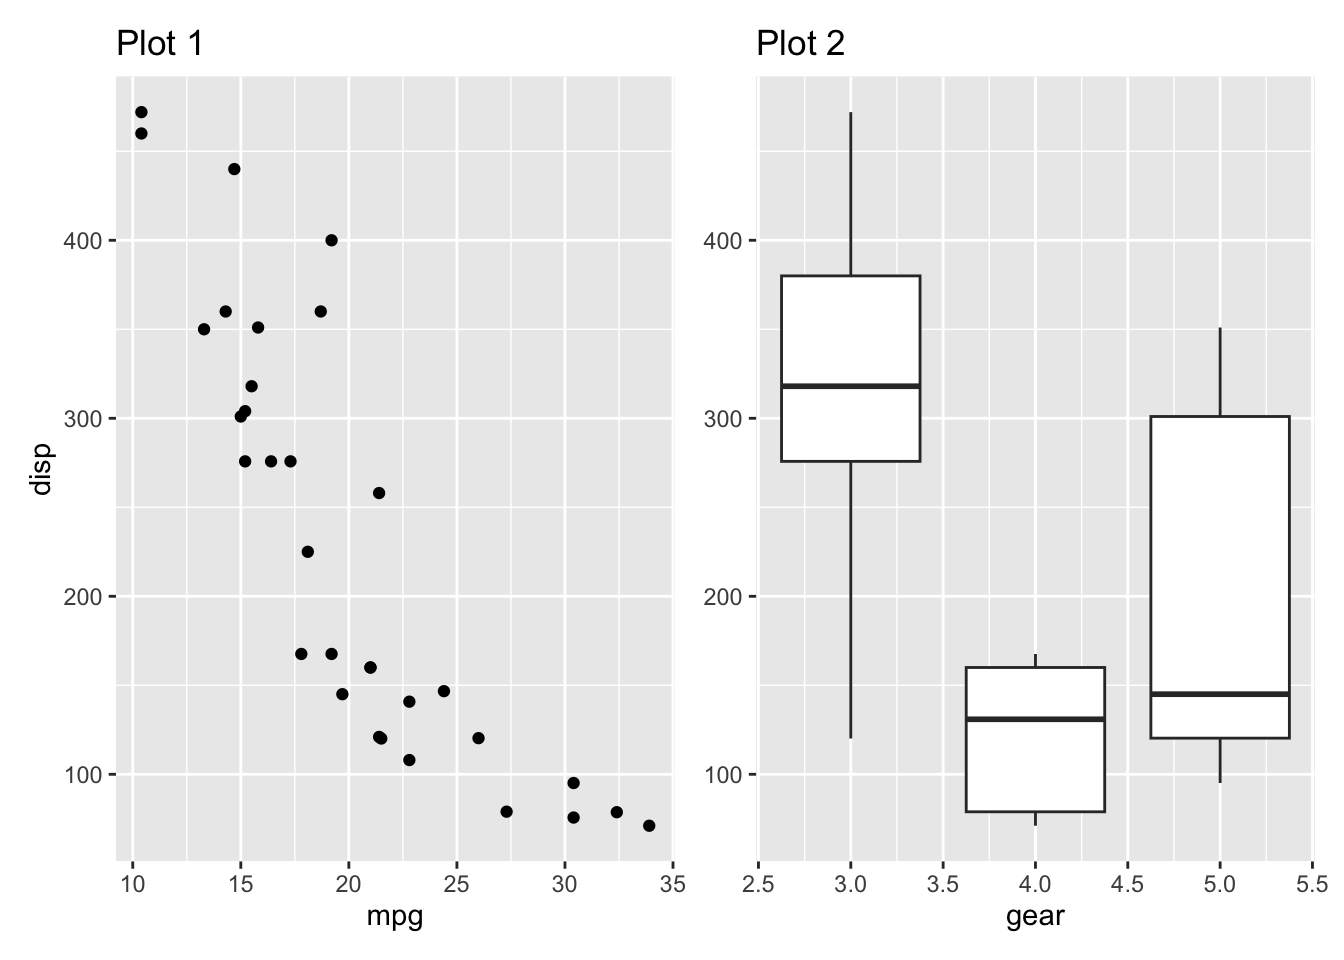
Titles are collected if they are identical and the same is true for axes. This means that if you have two plots showing the same on the y-axis but with different ranges you can collect the titles but not the axis
p1 + p2 + coord_cartesian(ylim = c(100, 300)) + plot_layout(axes = "collect")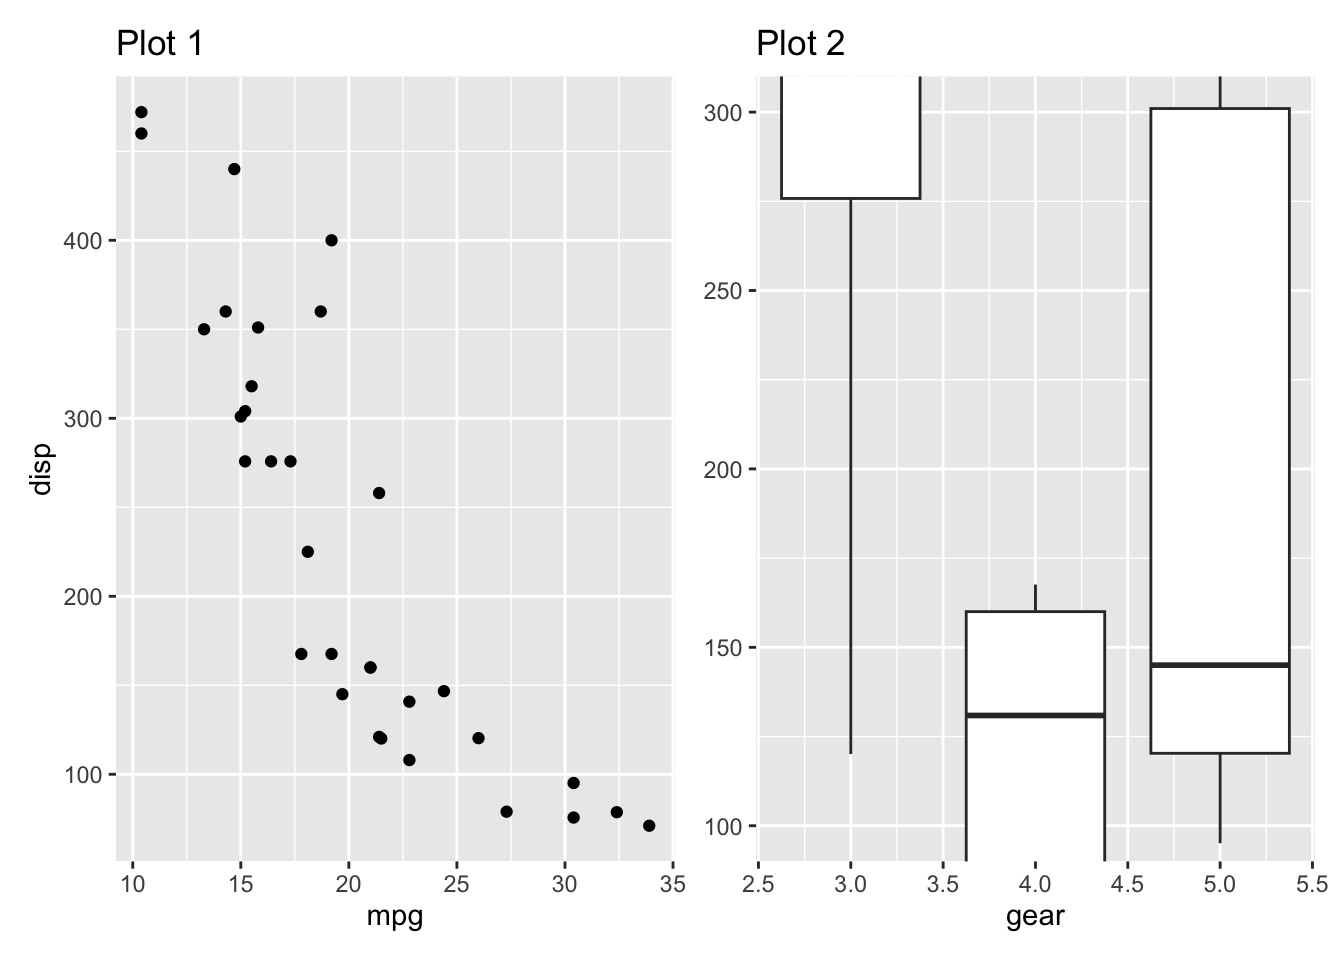
There is no facility to align the range of axes across plots so you’d still need to keep an eye on that. Still, you can always use & to apply the same coordinate system or scale to all plots in a patchwork so it should be relatively easy to line up plots.
One difference from the legend collection is that collecting axes only works for plots in the same nesting level. There are reasons for this, mainly my sanity level and capacity to sleep at night. Still, it means that one should be aware of the “hidden” nesting that can occur when using / and | for composition:
p1 + (p1 | p2) + plot_layout(axes = "collect")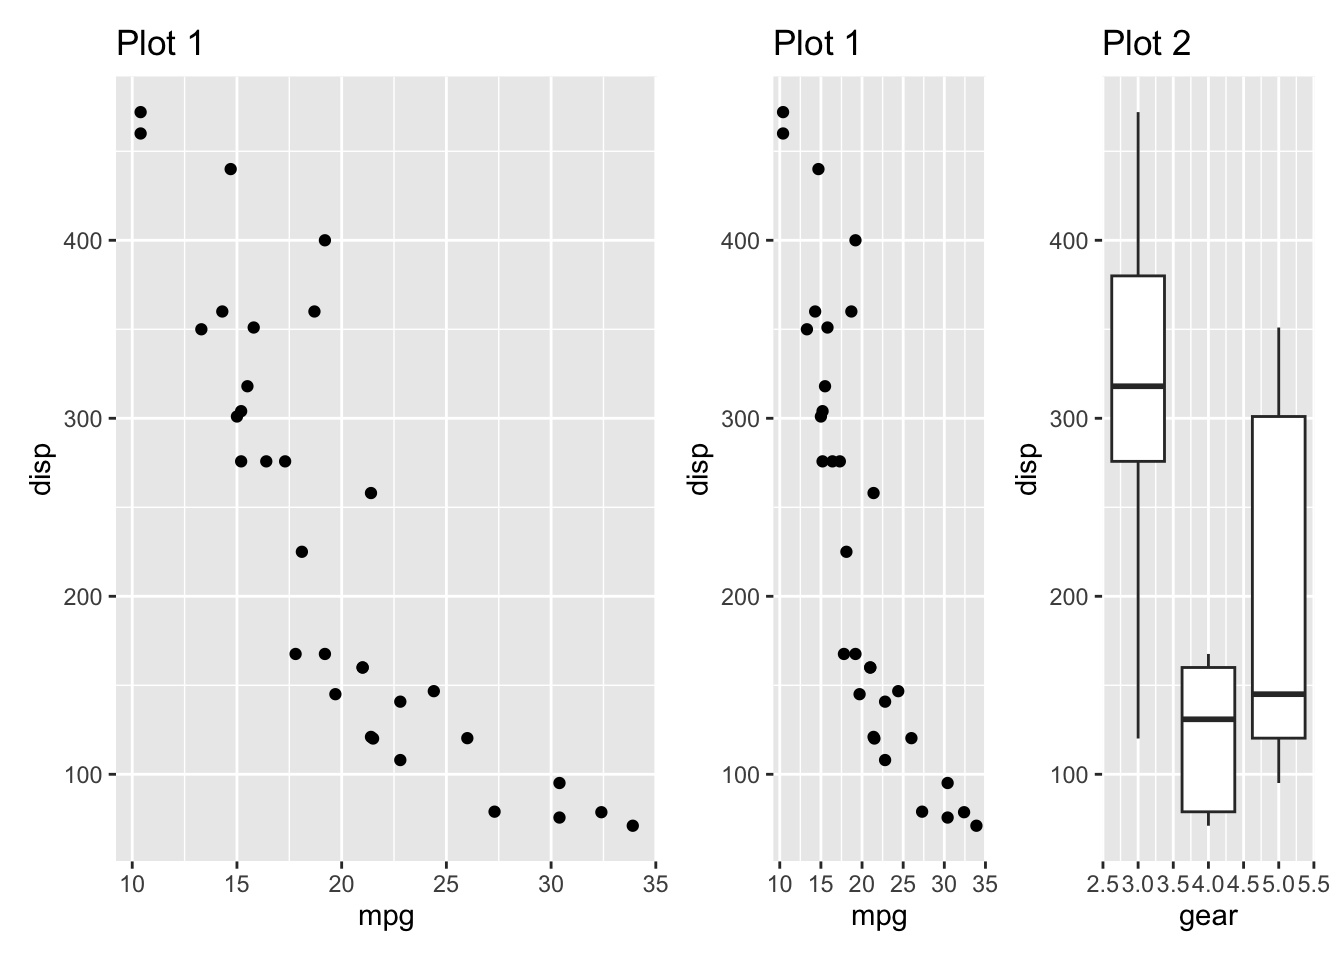
A better approach for this would be to keep the same nesting level but use the widths argument to get the same look
p1 + p1 + p2 + plot_layout(widths = c(2, 1, 1), axes = "collect")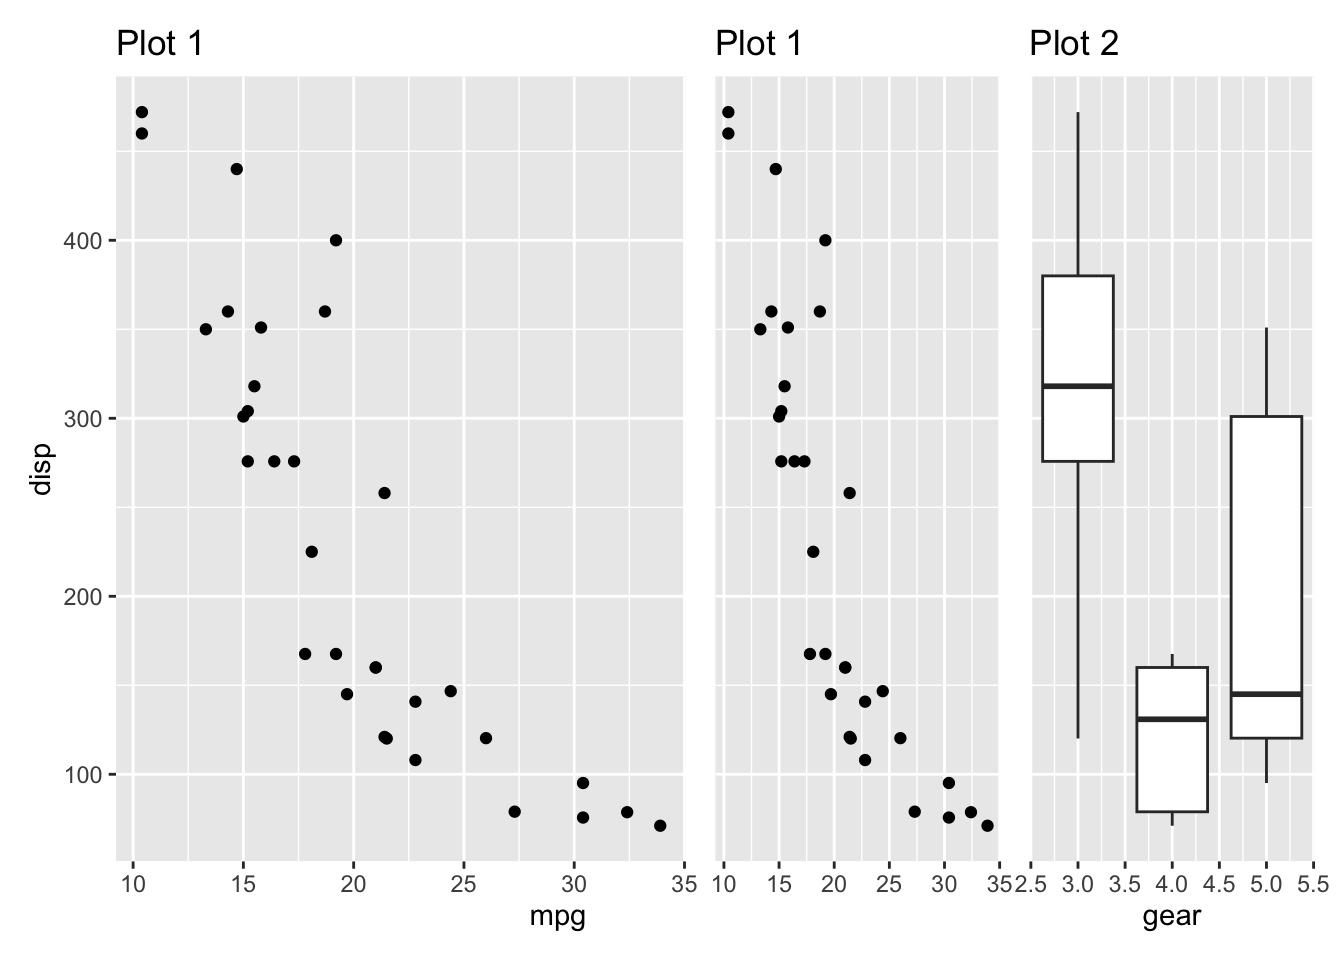
The attentive reader will observe that apart from “fixing” the problem at hand, something else happened to the plot. The middle plot suddenly lost it’s x-axis title and the x-axis title of the left plot got moved somewhat to the right. This is because axis title collecting works in both directions, i.e. if adjacent axis titles are identical they will get merged and the final title will occupy the full area of the merged ones. The effect may be more clear in a simpler layout:
p1 / p2 + plot_layout(axis_titles = "collect")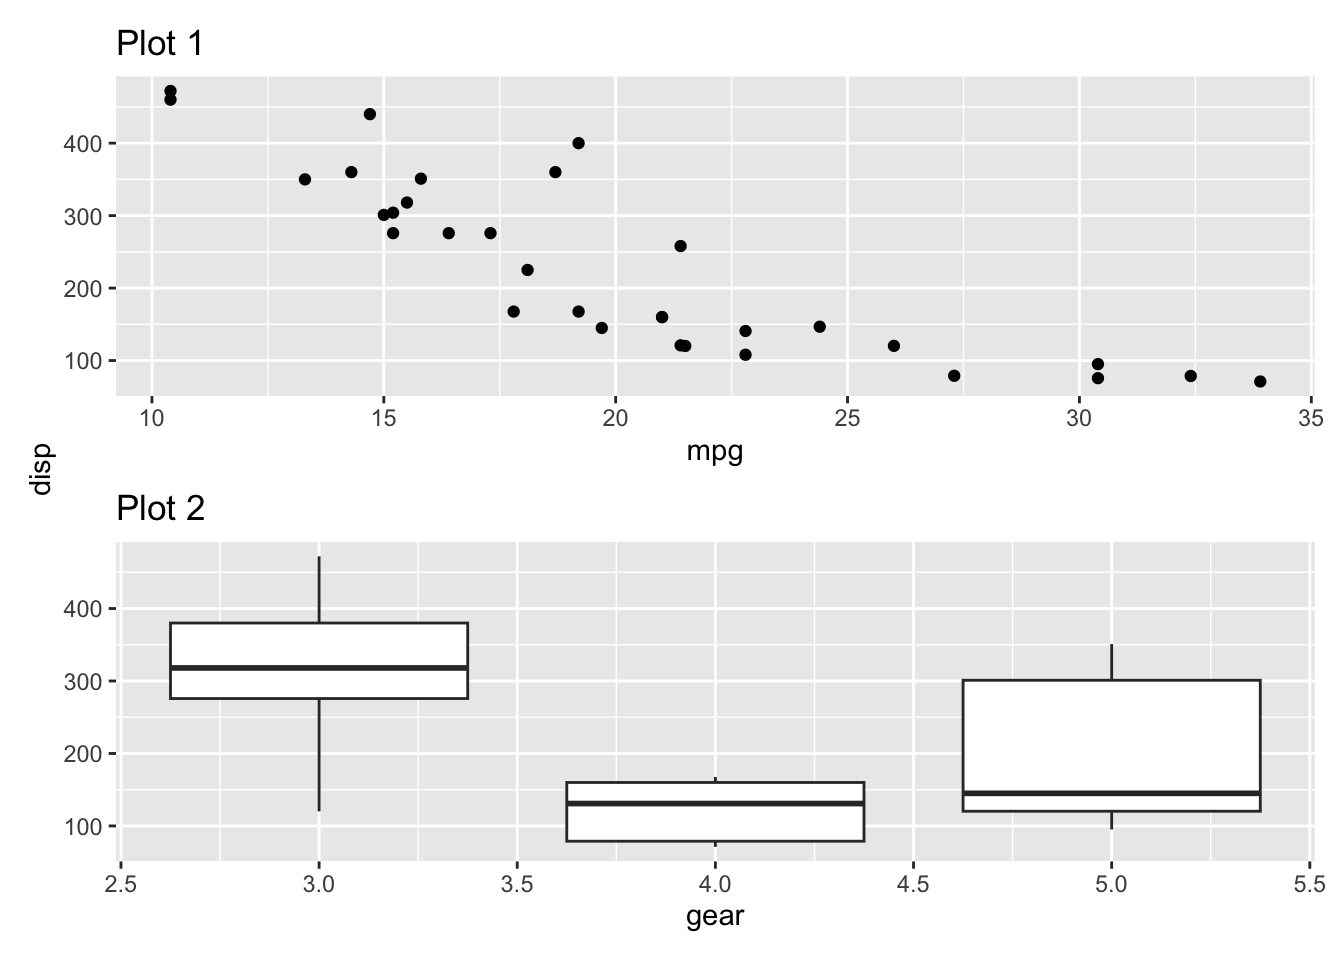
For the prior plot, if we would like to avoid this behavior because it is not obvious which x-axis title the middle plot relates to, we can set the collecting to only happen in one direction
p1 + p1 + p2 + plot_layout(widths = c(2, 1, 1), axes = "collect_y")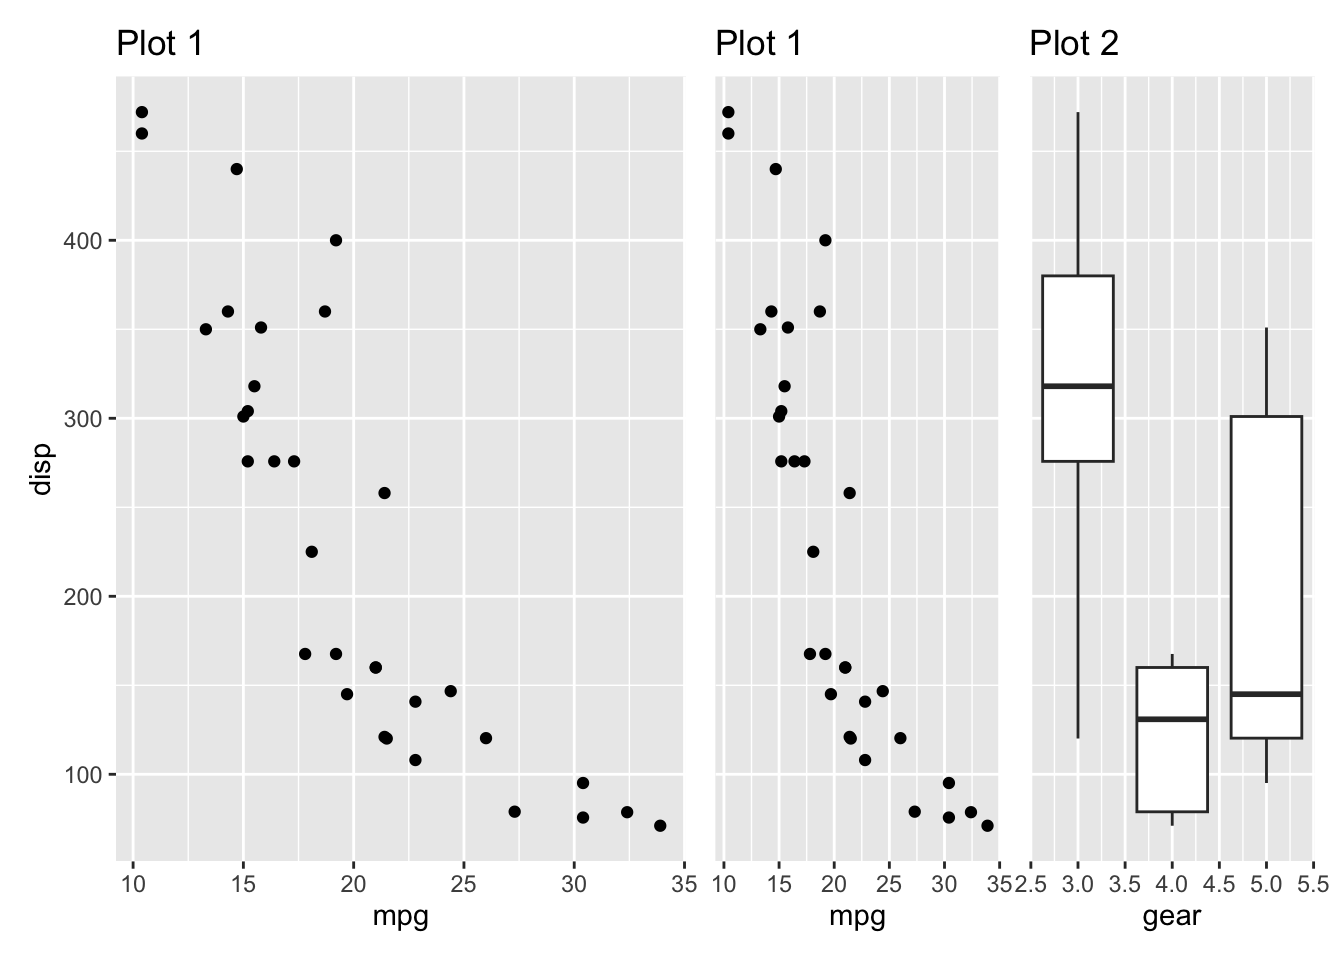
The other feature I’ll discuss will probably make a lot of people happy. The number of questions about how to not align plots are numerous and usually comes down to plots with excessively long y-axis labels (sorry for keeping with the mtcars dataset — I know we got it figured out quite well at this point):
p3 <- ggplot(mtcars) +
  geom_bar(aes(y = factor(gear), fill = factor(gear))) +
  scale_y_discrete(
    "",
    labels = c("3 gears are often enough",
               "But, you know, 4 is a nice number",
               "I would def go with 5 gears in a modern car")
  )
p3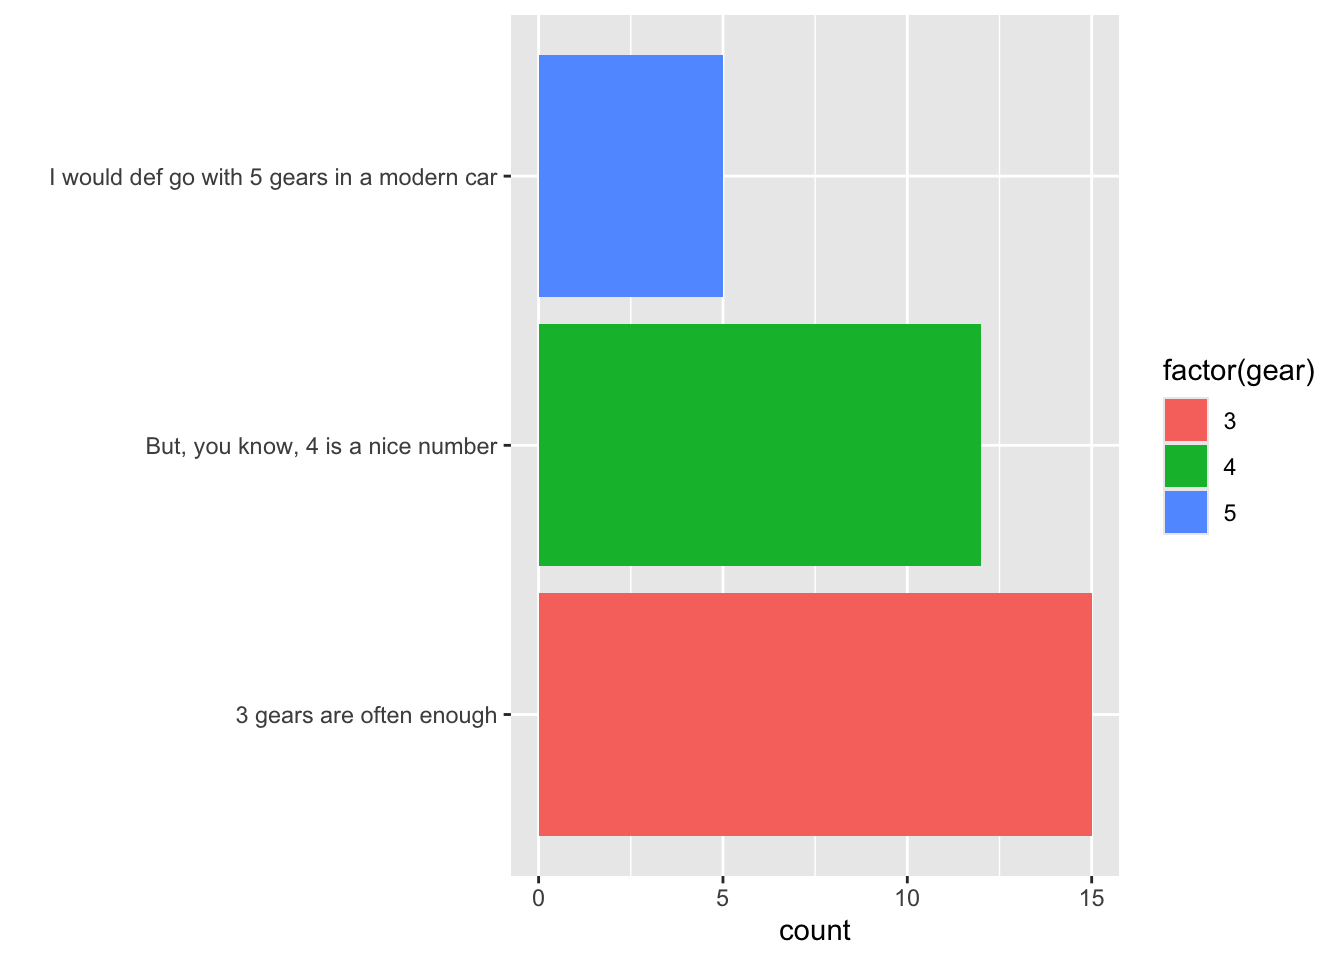
We can see how such a plot could mess up a composition
p1 / p3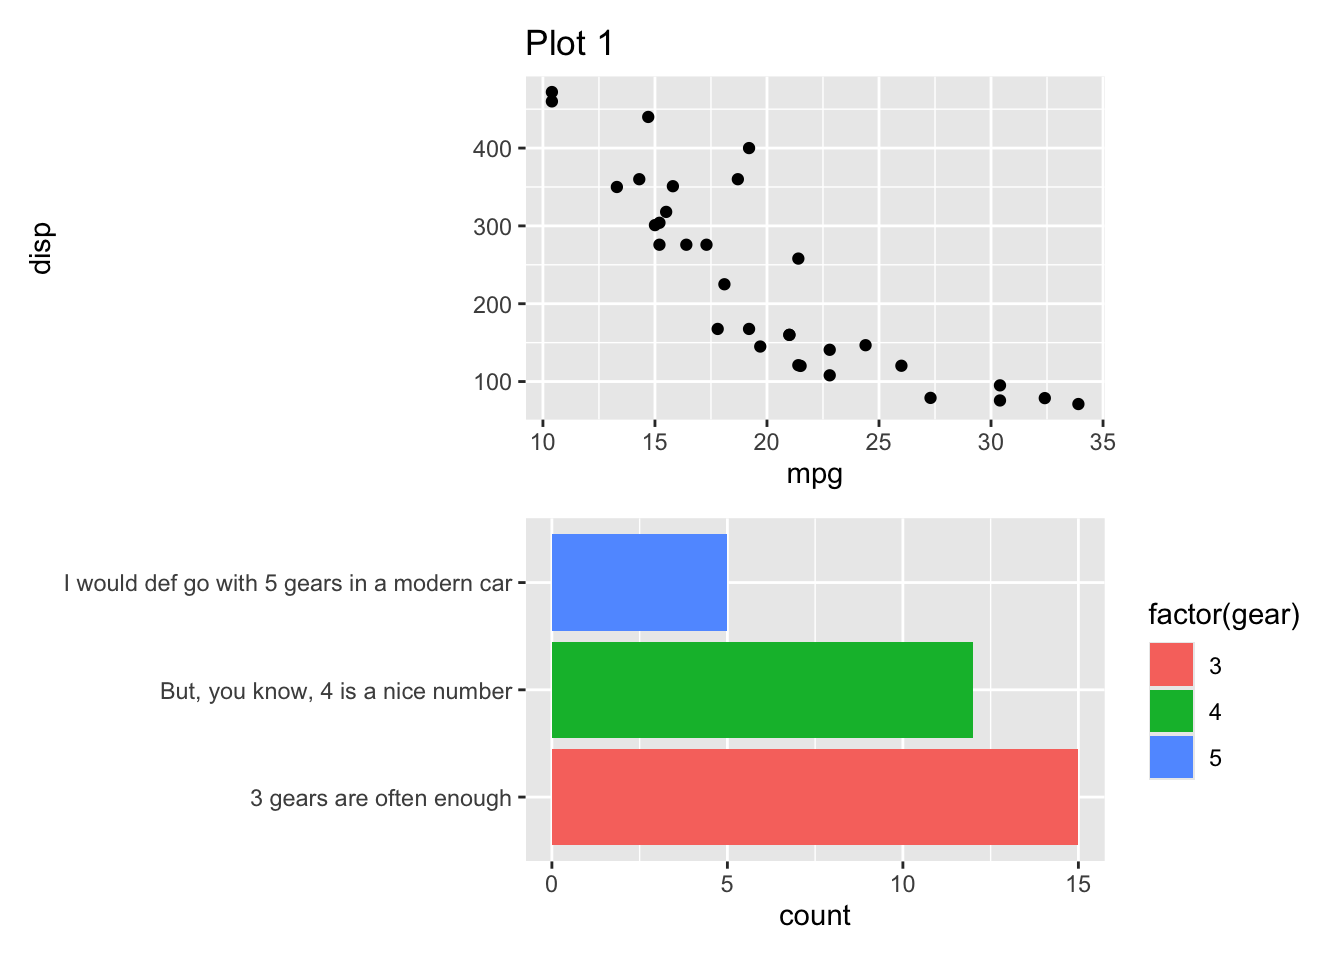
My answer to these questions/issues has always been to use wrap_elements() which, to be fair, gets the job done OK’ish
p1 / wrap_elements(plot = p3)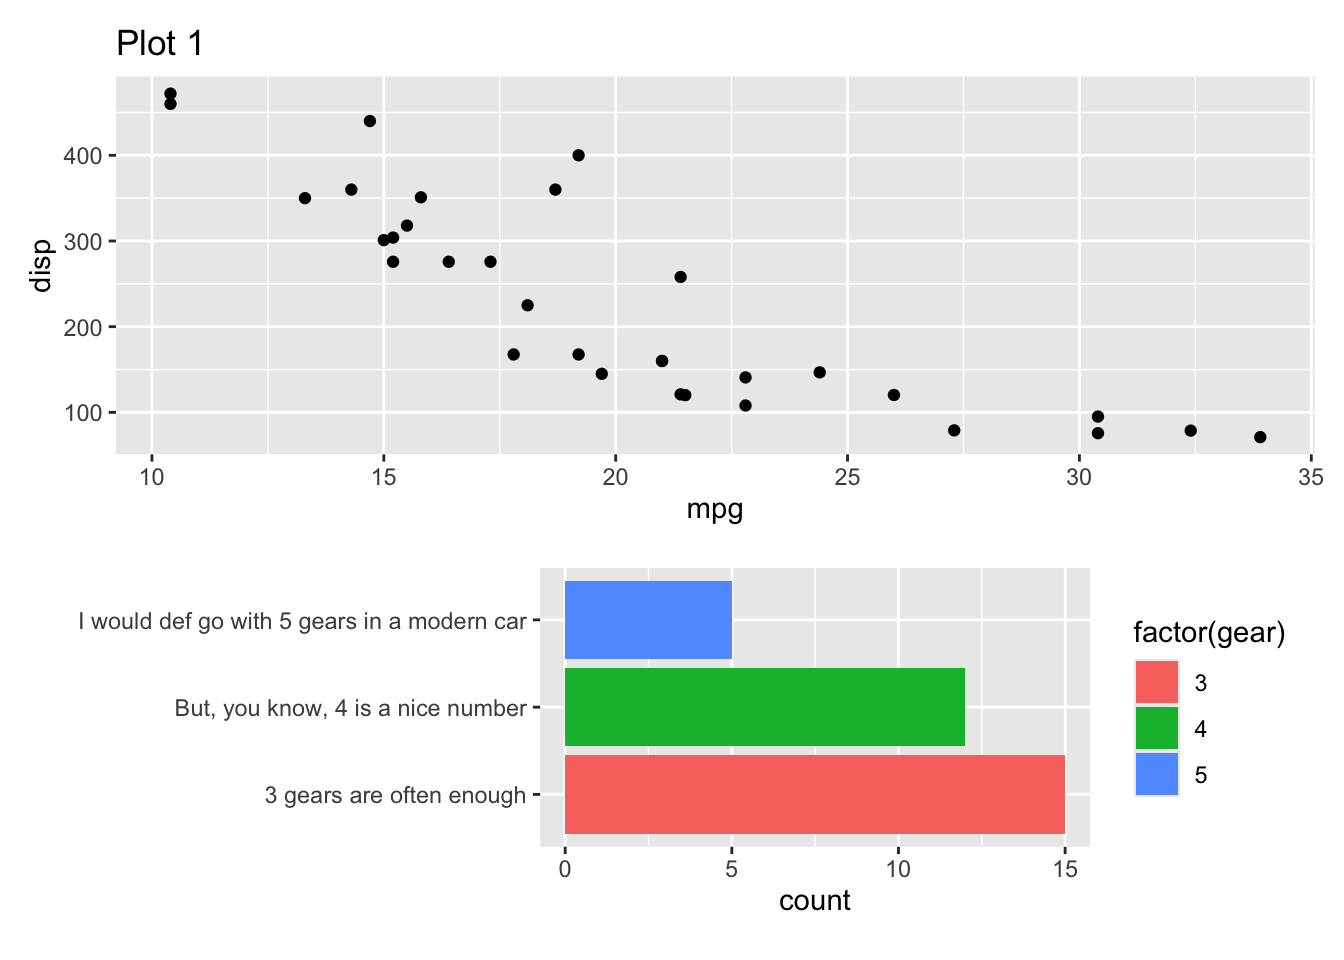
However, there are some shortcomings to this approach. First, it is pretty verbose and not very descriptive of what it does/what your intent is. This is not the end of the world, but the API of patchwork is pretty great (IMHO) so it feels like a bad concession to give all that up here. Second, using wrap_elements() “freezes” the plot inside it, so you can no longer modify it, e.g. with & or through guide collecting:
p1 / wrap_elements(plot = p3) + plot_layout(guides = "collect") & theme_dark()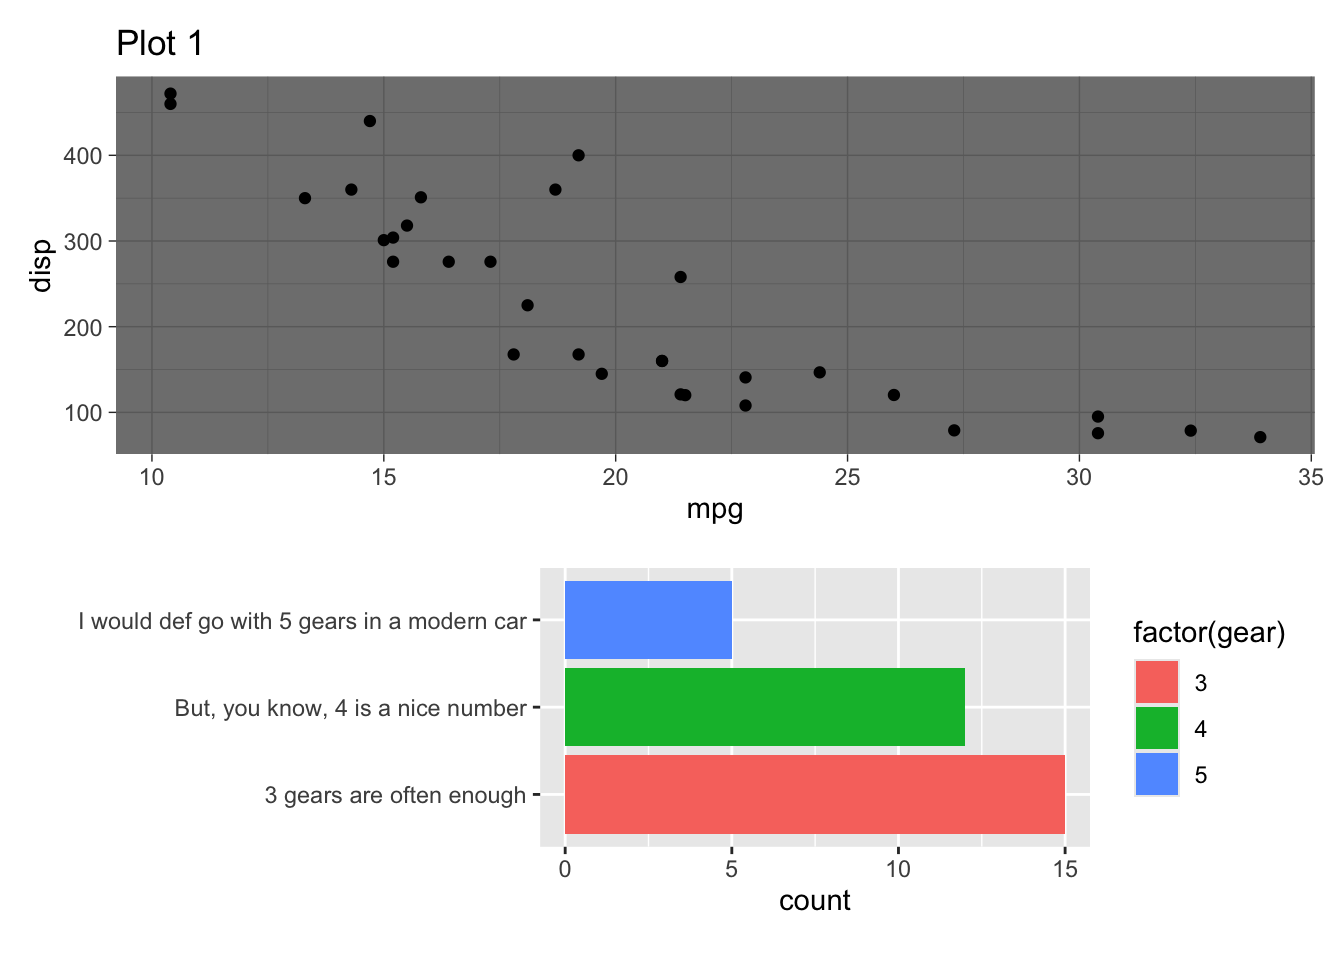
Another thing is that the plot margin is part of the plot that gets inserted into the plot region. If we remove the legend and increase the margin we can see an annoying misalignment between the right edges of the plots:
p1 / wrap_elements(plot = p3 + theme(plot.margin = margin(20, 20, 20, 20), legend.position = "none"))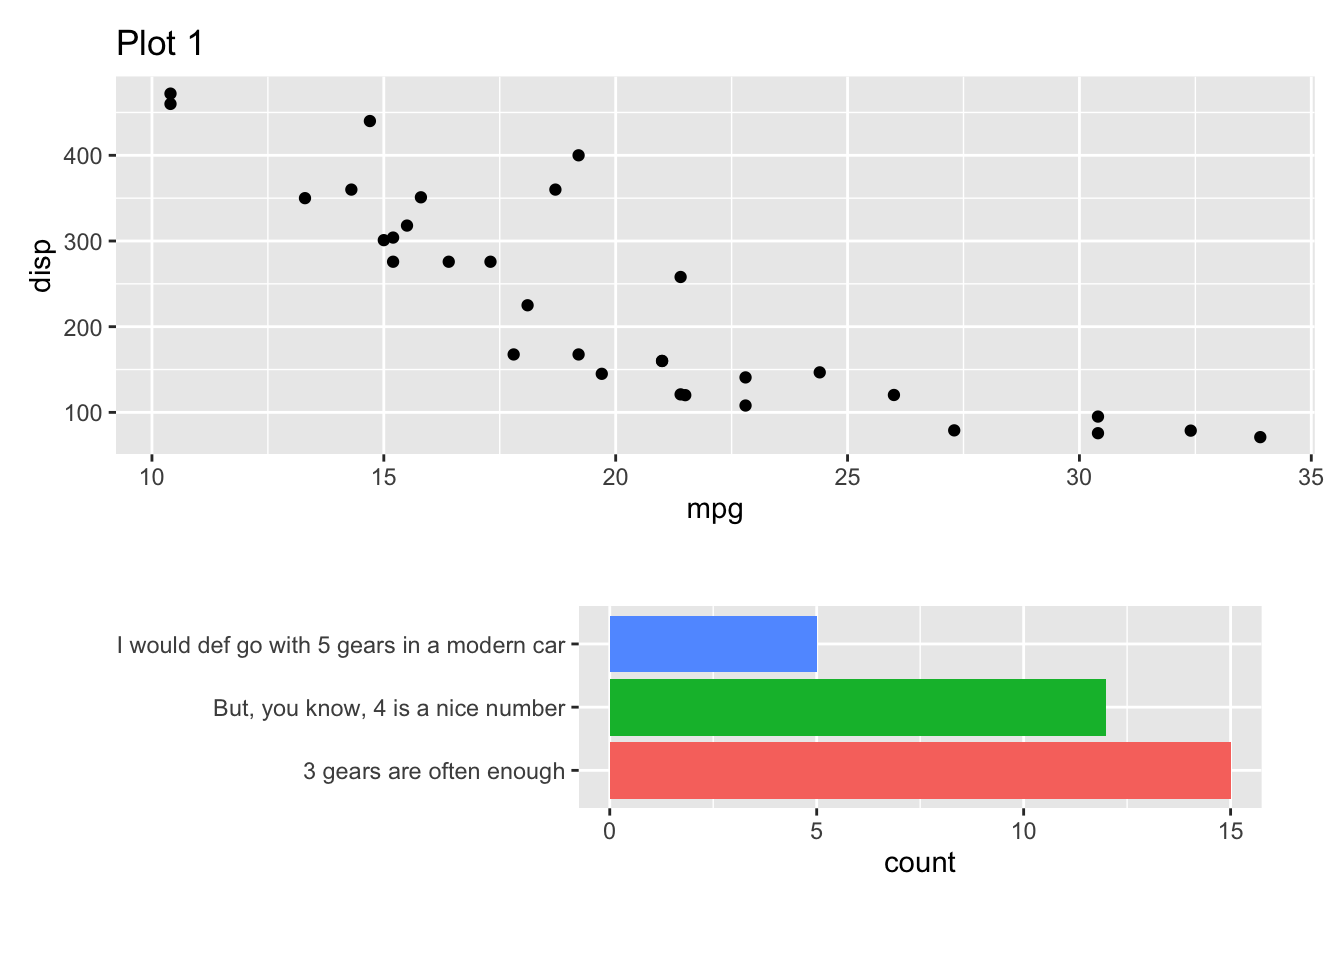
That was a lot of dunking on wrap_elements(). This is mainly because it was the wrong tool for the job, not because there is anything particularly wrong with it as is. No matter, we now have the right tool:
p1 / free(p3) + plot_layout(guides = "collect") & theme_dark()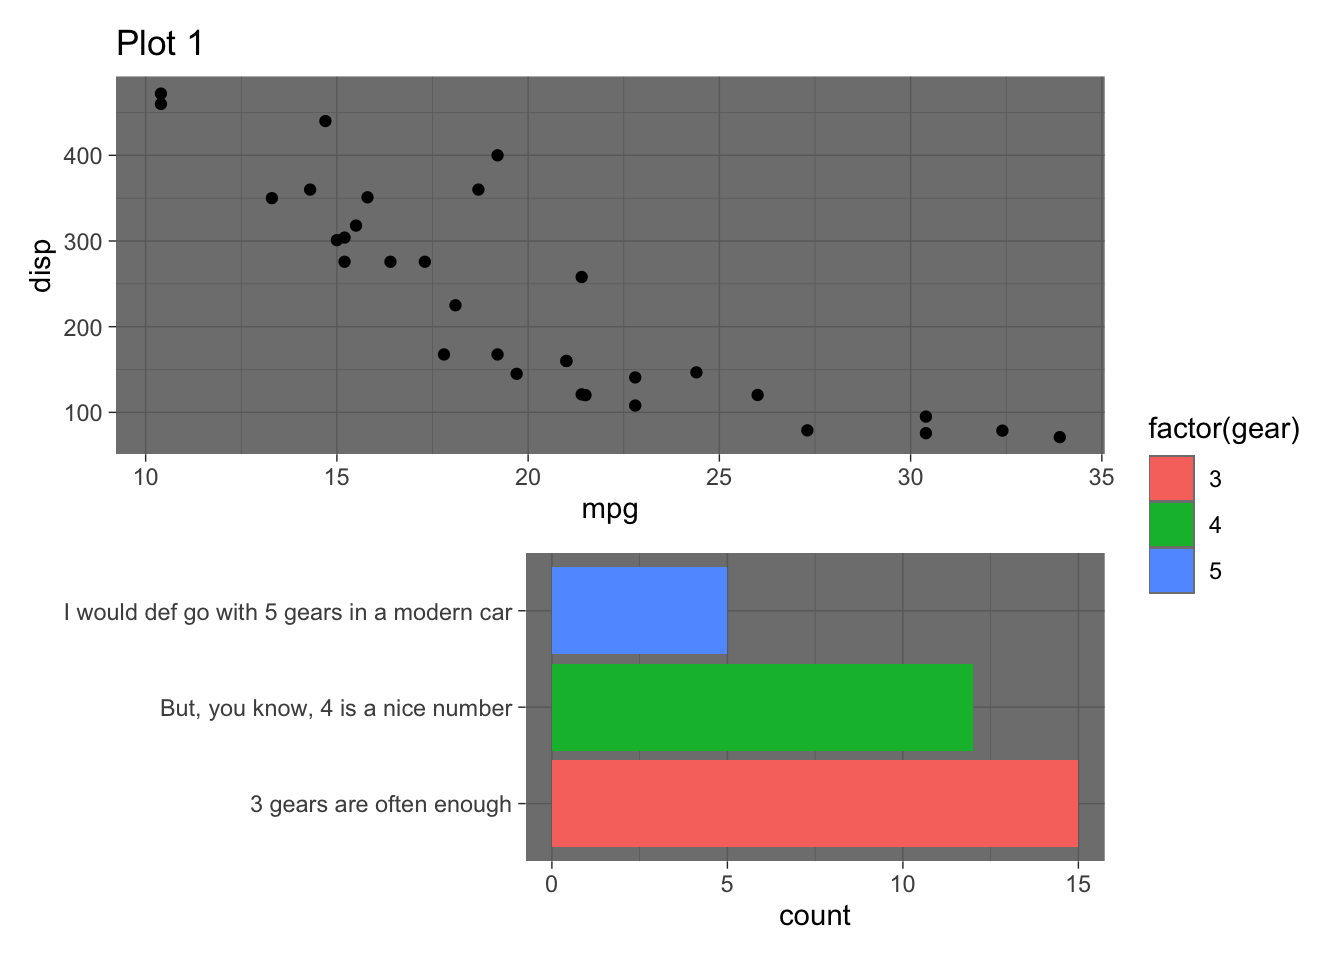
There is not much more to it. Wrap a plot in free() if you want to forego the alignment that patchwork performs and it will do exactly that without getting in the way of the other functionality in the patchwork.
And now it is time to leave mtcars alone. Happy plotting!